


How Data Tools Help Government Tackle Climate Science, Find War Criminals
Geospatial information systems are helping agencies like NOAA and the State Department make decisions using data visualization tools.

Agencies are using geospatial information systems (GIS) to support missions like the climate crisis and monitoring the location of war criminals, federal officials said recently at Esri’s annual Federal GIS Conference in Washington, D.C., last week.
Finding and Tracking War Criminals
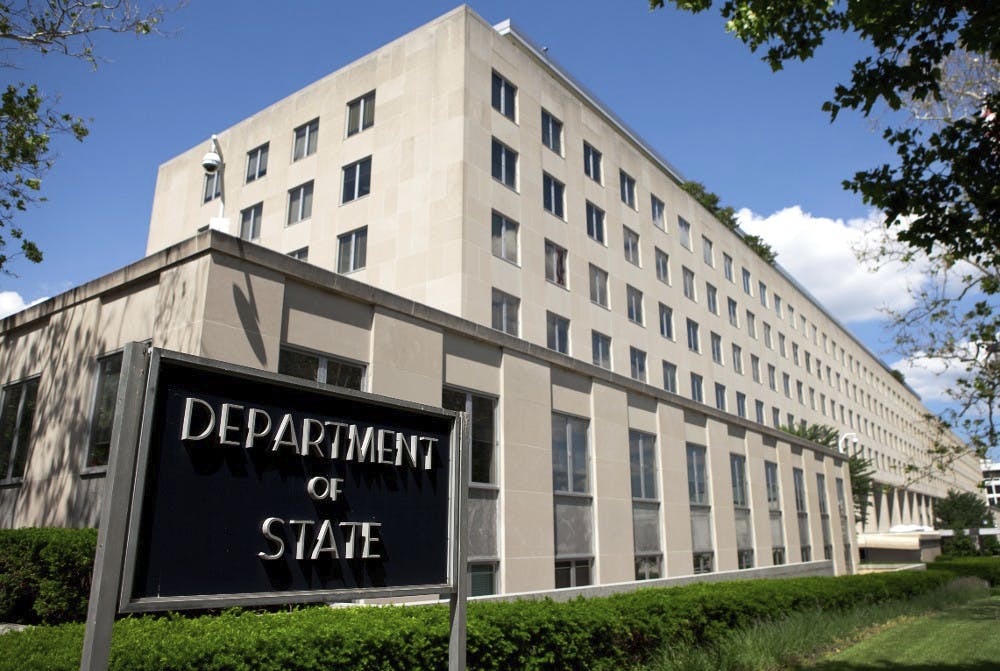
The State Department is using GIS to monitor the ongoing war between Russia and Ukraine, officials said during the conference. The platform has helped hold Russia accountable for war crimes, such as forced adoption and starvation, and even issued two arrest warrants.
“We’ve really tried to focus on making sure that we are developing potential evidence to hold the alleged perpetrators of atrocities to account for those and that really is one of the driving focuses, especially for Ukraine Conflict Observatory,” said director of the Conflict Observatory team based at Yale Humanitarian Research Lab, Caitlin Howarth.
Howarth and others at the Ukraine Conflict Observatory are working to ensure they are using effective imagery, open-source data and assessing metadata to have the most accurate answers. An example Howarth provided was looking at the probability medical facilities were being targeted at a higher rate than other facilities.
“There should be a differentiation that you see, where there is less clustering and bombardment on those sites, and we’re seeing an absence of that,” Howarth said. “What we have instead documented is that in Mariupol, Ukraine, that medical facilities are in fact hit at four times the rate of buildings of comparable size.”
In addition to mapping attacks on facilities, Howarth’s team has mapped the “systemic damage” to Ukraine’s crop storage. With help from national laboratory teams and partners at Oak Ridge National Laboratory, they’ve developed an algorithm with AI and machine learning to identify crop storage facilities safely and securely.
“[We were able to] perform our analysis using open-source material, identifying crop storage facilities, conducting a comprehensive analysis countrywide, and publish the results but to do so protected the overall site location so that we didn’t have to release information that effectively would have improved the targeting capacity of anyone who’s party to the conflict,” Howarth said.
Predicting Sea Rise Levels for Communities
Members from the National Oceanic and Atmospheric Administration (NOAA), Old Dominion University and Esri discussed their recent case study regarding rising sea levels and coastal resiliency in Norfolk, Virginia.
“We’ve got these great people from NOAA who are building the science that my team uses to do flood modeling and storm surge modeling,” said George Mcleod, coastal oceanographer and director of the Geospatial Research Center at Old Dominion University.
The team created maps to showcase areas of the city that would be the most impacted by the “existential flooding problem” in 2050 and 2100. Using data from the 2022 interagency technical report about sea level rise and a virtual reality (VR) headset, users can see realistic sea level scenarios of what the neighborhood would look like if no action were taken.
“We are trying to use those and to be able to help people create nuanced plans for the future. This area has seen six of its top 10 floods since the year 2000,” said NOAA oceanographer Karen Kavanaugh. “These scenarios are coming from computer models and observational data. It’s really grounded in the best available science … and it’s really an authoritative dataset you’re seeing visualized.”
Mcleod cited Dangermond’s opening presentation and the recent conversation around digital twins, a GIS tool that allows users to create a live replica of cities, businesses and more.
“This is the best science modeled in virtual reality to try to bring as accurate of a depiction as possible to the end user,” Mcleod said. “We’re trying to do is and get it as right as possible. And when we realize we made a mistake somewhere, [we say] let’s make it better.”
Mitigating Health Issues Impacted by Climate Change
“All of these climate-induced health challenges call for a response that is collaborative, strategic, and rooted in both science and technology. And that’s why geography and a geographic approach are so powerful,” said Chief Medical Officer and Health Solutions Director for Esri Este Geraghty at the event.
Both Geraghty and John Balbus, director of the Office of Climate Change and Health Equity at the Department of Health and Human Services, use GIS to address health disparities and mitigate health system surges during extreme weather events and pandemics.
Balbus said his office is using an action-oriented approach to provide health care providers and communities with the tools they need to deal with the impact of climate change. His office created a 30- to 90-day forecast for each region of the United States to predict heat emergencies, wildfires and droughts in a static narrative format. Balbus and his team created an interactive map that utilizes the forecast with county data to show which communities are most at risk for a negative health outcome.
“You can come down on your county [in the portal] and be able to see what is your particular level of demographics and other population characteristics that would be the people that you would want to target the most for those kinds of problems associated with drought, heat and wildfires,” Balbus said.

This is a carousel with manually rotating slides. Use Next and Previous buttons to navigate or jump to a slide with the slide dots
-

TMF Tightens Scrutiny as Agencies Prove Modernization ROI
TMF's leader said agencies must link modernization to workload speed, faster processing and user impact over hypothetical long‑term savings.
3m read -

VA Backs Goal of House Data Sharing Bill but Seeks Key Revisions
VA officials told Congress they support a draft bill to improve care coordination but said legal barriers to data sharing remain unresolved.
3m read -

Executive Order Speeds Up Post-Quantum Cryptography Timelines
A new White House executive order and OMB guidance call for faster post-quantum cryptography migration for federal agencies.
3m read -

Treasury's Data Transparency Push Brings 250 Years of Federal Finance Into Focus
Justin Cole discusses Treasury's new data initiative, AI's role in public access, and why trusted government financial data remains essential.
10m listen


